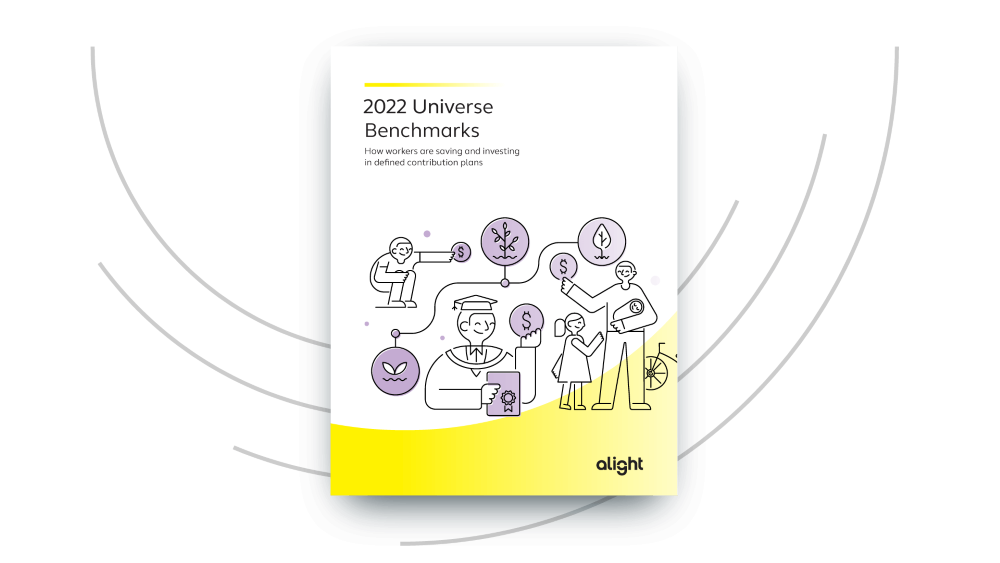
Our 2022 Universe Benchmarks report is the latest in a long line of annual reports that illustrate how workers are saving and investing in defined contribution (DC) plans. This year’s version features data from 100 plans covering more than three million eligible participants. It highlights the most common benchmarking statistics, including plan participation rates, savings rates, balances, investment and trading activity and distributions from accounts (e.g. loans, withdrawals, cash-outs and rollovers).
Last year, as participants adjusted to a new normal post-pandemic, workers remained steadfast in saving for retirement. Our data revealed that the average defined contribution (DC) plan balance hit an all-time high of $144,280 at the end of 2021, up 10% from 2020. Median plan balances also increased, from $28,426 to $29,607, another record high. Despite these improvements, employers are determined to do more to help workers improve their retirement readiness.
See the highlights below and download the full report for detailed insights on workers’ behaviors in DC plans.
Despite the pandemic and labor challenges, DC plan contribution rates and balances continue to increase.
Average plan balance is at an all-time high, up 10% from 2020
Average contribution rates, up from 8.1% in 2019
of DC plans have 90% of eligible participants contributing to the plan; a decade ago less than a third had a 90% participation rate or higher
Workers are keeping their savings intact, tapping into their retirement accounts at record-low levels
of participants now have an outstanding loan – the lowest we’ve seen in over 20 years
of workers initiated a new loan, roughly half of the percentage from 10 years ago
of people took a cash distribution, down from 44% in 2019

If you are interested in a more in-depth analysis of plan data, including deeper cuts by age, gender, tenure and industry, talk to us!
Looking for more insights from Alight’s Universe Benchmarks report?
Please fill out the form to download the latest observations.
